扫一扫 添加小助手
服务热线
13818320332
扫一扫 关注我们

The U.K.’s Medicines and Healthcare products Regulatory Agency (MHRA) has taken a different approach in the publication of the GMP deficiencies for drug product issued during inspections in 2018 and published in October 2019. In 2015 and 2016, the MHRA provided approximately 100 slide decks with tables, figures, and text from deficiencies against the requirements in the chapters and annexes. No data were published for 2017. The MHRA published a 6,200+ line Excel spreadsheet of its 2018 GMP inspection data so that individuals can parse and present the data according to their needs.
英国MHRA在2019年10月发布的2018年药品GMP检查缺陷方面采取了不同的方法。在2015年和2016年,MHRA根据章节和附件的要求,提供了大约100张幻灯片,其中有表格、图表和文本。2017年的数据没有公布。MHRA发布了一份包含2018年GMP检查数据的6200多行的Excel电子表格,这样每个人都可以根据自己的需要解析和呈现数据。
Background
背景
I found the “Notes and Guidance” segment of the MHRA spreadsheet a bit confusing. In light of this, here’s how I’ve parsed the data. Each row in the spreadsheet is treated as a unique deficiency, regardless of whether it is a “deficiency” or a “sub-point” as identified in theNotes and Guidance section of the MHRA publication. I cannot discern which is which in the spreadsheet, so I treat them all equally. The summary data from 2015 and 2016 are taken directly from the MHRA 2016 report. Data were not posted for 2017.
我发现MHRA电子表格中的“备注和指引”部分有点令人困惑。鉴于此,下面是我解析数据的方式。电子表格中的每一行都被视为一个独特的缺陷,不管它是“缺陷”还是“子点”,如MHRA出版物的备注和指引部分所标识的那样。我在电子表格中分不清哪个是哪个,所以我对它们一视同仁。2015年和2016年的汇总数据直接取自MHRA 2016年报告。2017年的数据没有公布。
Overall Data
数据概览
The MHRA conducted 285 GMP inspections, both domestic and outside of the U.K., in 2018. Inspections outside the U.K. were conducted in Bangladesh, China, India, Japan, Singapore, South Korea, and the United States. Country-specific data, other than that provided for the U.K. and “overseas,” was not provided in the 2015 and 2016 MHRA reports. The 285 inspections from 2018 reflect a decrease from the number of inspections conducted in both 2015 and 2016.
2018年,MHRA在英国国内外进行了285次GMP检查。英国以外的国家分别是孟加拉国、中国、印度、日本、新加坡、韩国和美国。在2015年和2016年MHRA的报告中,除了提供给英国和“海外”的数据外,没有提供其他具体国家的数据。2018年的285次检查反映了相比2015年和2016年检查次数的减少。
Table 1 identifies the number of drug product inspections, by country, performed by the MHRA in 2018. As in past years, almost all MHRA inspections were conducted in the U.K. The percentage of inspections conducted in the U.K. in 2018 increased slightly from 2015 and 2016 and the percentage of overseas inspection decreased slightly in 2018 to 20 percent of the total.
表1列出了2018年MHRA按国家对药品进行的检查次数。与过去几年一样,几乎所有的MHRA检查都是在英国进行的。2018年在英国进行的检查比例比2015年和2016年略有上升,2018年在海外进行的检查比例略有下降,为20%。
In 2018, the largest number of inspections conducted outside the U.K. were performed in India, with a total of 43. The remaining 14 inspections outside the U.K. were conducted in six countries, with China and the U.S. each the subject of five inspections, and the other countries with one each.
2018年,在英国境外进行的检查最多的是在印度,共有43次。英国以外的其他14次检查是在6个国家进行的,中国和美国各5次,其他国家各1次。
Table 1: MHRA Inspections by Country
MHRA检查(按国家)
|
Country
国家 |
Number of Inspections
检查次数 2015 / % total |
Number of Inspections 检查次数 2016 / % total |
Number of Inspections 检查次数 2018 / % total |
|
Total总数 |
303 |
324 |
285 |
|
U.K.英国 |
224 / 74% |
242 / 75% |
228 / 80% |
|
Overseas Inspections 海外检查 |
79 / 26% |
82 / 25% |
57 / 20% |
|
India印度 |
|
|
43 / 15% |
|
China中国 |
|
|
5 / 2% |
|
United States美国 |
|
|
5 / 2% |
|
Bangladesh孟加拉 |
|
|
1 / 0.3% |
|
South Korea韩国 |
|
|
1 / 0.3% |
|
Singapore新加坡 |
|
|
1 / 0.3% |
|
Japan日本 |
|
|
1 / 0.3% |
Table 2 shows the trend, including all classification of deficiencies from 2015, 2016, and 2018 identified in the top 10 chapters and annexes. Data from 2015 and 2016 are taken directly from the 2016 report published by the MHRA. Quality Systems leads the list in all three years. Notable changes in 2018 from the two previous years include:
表2显示了趋势,包括与排名前10的章节和附录有关的2015年、2016年和2018年的所有缺陷分类。2015年和2016年的数据直接取自MHRA发布的2016年报告。质量体系在这三年中一直位居榜首。2018年与前两年相比的显著变化包括:
Outsourced Activities (Chapter 7) appears within the top 10 in 2018, though it did not appear in either of the two other years.
外包活动(第7章)出现在2018年的前十名中,尽管前两年都没有出现。
Personnel (Chapter 2) is no longer among the top 10 in 2018.
人员(第2章)不再是2018年的前十名。
Computerised Systems (Annex 11) remains within the top 10 in 2018, although it fell from fifth place in 2015, to seventh in 2016, and to 10th place in 2018.
计算机化系统(附录11)尽管从2015年的第5名,2016年的第7名滑落,但仍在2018年的前10名之内(第10)。
Complaints and Recalls (Chapter 8) also diminished in rank over the time period, from second in 2015, to fourth in 2016, and eighth in 2018.
投诉和召回(第8章)的排名也有所下降,从2015年的第2、2016年的第4到2018年的第8。
Table 2: Overall Deficiency Trend Comparison, Top 10
Top10缺陷趋势
|
Rank排名 |
2015 |
2016 |
2018 |
|
1 |
Quality Systems 质量体系 |
Quality System 质量体系 |
Quality System 质量体系 |
|
2 |
Complaints and Recalls 投诉和召回 |
Sterility Assurance 无菌保证 |
Documentation 文件 |
|
3 |
Documentation 文件 |
Production 生产 |
Production 生产 |
|
4 |
Quality Control 质量控制 |
Complaints and Recall 投诉和召回 |
Validation / Qualification 验证/确认 |
|
5 |
Computerised Systems 计算机化系统 |
Qualification / Validation 验证/确认 |
Premises and Equipment 设施与设备 |
|
6 |
Production 生产 |
Premises and Equipment 设施与设备 |
Sterility Assurance 无菌保证 |
|
7 |
Premises and Equipment 设施与设备 |
Computerised Systems 计算机化系统 |
Quality Control 质量控制 |
|
8 |
Validation 验证 |
Personnel 人员 |
Complaints and Recall 设施与设备 |
|
9 |
Personnel 人员 |
Documentation 文件 |
Outsourced Activities 外包活动 |
|
10 |
Materials Management 物料管理 |
Quality Control 质量控制 |
Computerised Systems 计算机化系统 |
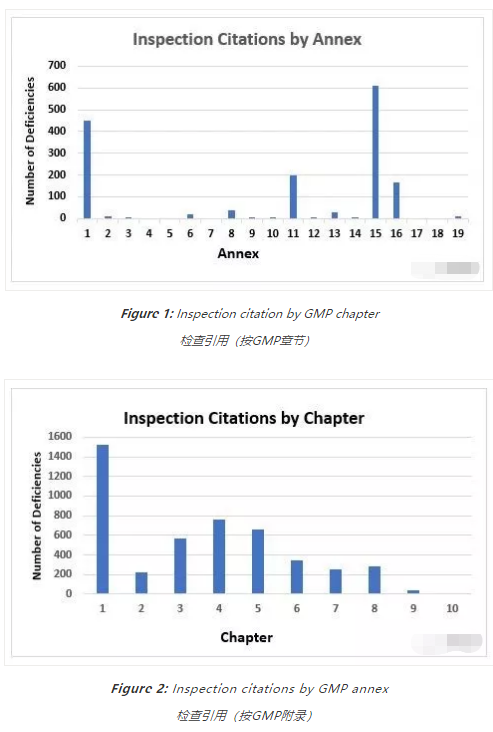
Figure 1 and Figure 2 present the total number of deficiencies according to the GMP chapter or GMP annex cited, respectively. These figures include all deficiency classifications — critical, major, and other. Annex 15, Qualification and Validation, and Annex 1, Sterility Assurance, take first and second place among the most frequently cited annexes, with approximately 600 and 450 deficiencies, respectively. This is followed by Annex 11,Computerized Systems, and Annex 16, Certification by a Qualified Person and Batch Release. All other annexes are associated with double-digit or fewer deficiencies.
图1和图2分别显示了引用的GMP章节或附录的缺陷总数。这些数字包括所有的缺陷分类-关键、主要和其他。附录15“验证和确认”和附录1“无菌保证”在最常被引用的附录中分别名列第1和第2,分别有大约600和450个缺陷。接着是附录11计算机化系统,和附件16 QP认证和批放行。所有其他附录都与几十个或更少的缺陷相关。

Chapter 1, Quality Management, with approximately 1,500 citations, has more than twice the number of deficiency citations as the nearest chapter. Chapter 4, Documentation, with almost 760 deficiencies, is closely followed by Chapter 5, Production, with just over 650, and Chapter 3, Premises and Equipment, at just under 570 citations. Chapters 2, 6, 7, and 8 each had between 200 and 400 deficiencies and, of the two remaining two chapters, one had fewer than 50 citations and the other had just one citation.
第1章,质量管理,大约有1500个引用,比最近的章节多两倍的缺陷引用。第4章,文件,有近760个缺陷,紧随其后的是第5章,生产,有650个缺陷,第3章,设施和设备,有570个缺陷。第2章、第6章、第7章和第8章各有200至400处不足之处,在剩下的2章中,有1章引用不到50次,另1章只有1次引用。
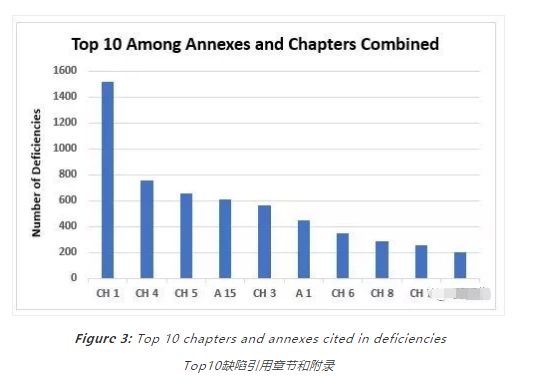
Figure 3 shows the top 10 categories when values from annexes and chapters are combined; the same information is provided in Table 2 with the number of associated deficiencies. Again, this includes all categories of deficiencies.
图3显示了来自附录和章节的值组合时的前10个类别;表2提供了相同的信息,其中列出了相关缺陷的数量。同样,这包括所有类型的缺陷。

Critical And Major Deficiencies
严重和主要缺陷
Table 3 provides a tabulation of all 2018 deficiencies by their classification. Critical deficiencies clearly constitute the smallest category; additional detail on these will be provided later. Major deficiencies constitute almost 40 percent of the total, and other deficiencies constitute the majority of the deficiencies at almost 60 percent of the total.
表3列出了2018年所有缺陷的分类。严重缺陷显然是最小的类别;关于这些的更多细节将在稍后提供。主要缺陷占总数的近40%,其他缺陷占大多数,占总数的近60%。
Table 3: Number of Deficiencies by Classification in 2018
2018年缺陷数量(按分级)
|
Classification 级别 |
Number 数量 |
Percentage of Total 占比 |
|
Critical严重 |
142 |
2 |
|
Major主要 |
2391 |
39 |
|
Other其他 |
3676 |
59 |
The majority of critical and major deficiencies among the 6,200-plus deficiencies cluster in a few chapters and annexes. Figure 4 shows the number of critical deficiencies and the chapters or annexes that are referenced. Among the critical deficiencies, 37 percent are associated with Chapter 1, Quality Systems, and 22 percent are associated with Annex 1,Sterility Assurance. Annexes 1 and 11 are the only other annexes that include citations for critical deficiencies; the remainder cite GMP chapters.
6200多个缺陷中大多数严重和主要缺陷集中在几个章节和附录。图4显示了严重缺陷的数量以及引用的章节或附件。在严重缺陷中,37%与第1章质量体系有关,22%与附录1无菌保证有关。附录1和11是仅有的严重缺陷引用的附录,其余严重缺陷引用GMP章节。
Tables 4 and 5 provide the specifics on the citations for Chapter 1 and Annex 1, respectively. The tables include the identifying paragraph, the number of times the deficiency was cited, and a short version of the text in the GMP guide.
表4和表5分别提供了关于第1章和附录1的引用的详细情况。这些表格包括识别段落、缺陷被引用的次数,以及GMP指南的简短文本。

In 2018 the MHRA conducted fewer inspections than in 2015 and 2016. The percentage of inspections conducted in the U.K. increased slightly and those outside the U.K. decreased slightly over that period. It will be useful to monitor whether the MRA with the FDA results in a decrease in the number of inspections of sites that they may both inspect. Because the MHRA only conducted five inspections in the U.S., it will be difficult to determine if the MRA with the FDA results in a decrease of inspection in the U.S.
2018年,MHRA的检查次数少于2015年和2016年。在此期间,在英国进行的检查的百分比略有上升,而在英国以外进行的检查的百分比则略有下降。监测和FDA的检查互认是否会减少他们可能同时检查的场所的检查次数将是有用的。因为MHRA只在美国进行了五次检查,很难确定互认是否会导致美国的检查减少
Chapter 7, Outsourced Activities, was new among the top 10 in 2018 but was not in the top 10 in either 2015 or 2016, and Chapter 2, Personnel, was no longer in the top 10 in 2018.
第7章,外包活动,在2018年的前10名中是新出现的,在2015年和2016年都没有进入前十名,第2章,人员,也不再是2018年的前10名。
In no surprise that Quality Systems, Chapter 1, continues to be first among the areas cited in inspection deficiencies, regardless of classification, with more than double the number of deficiencies of the next area, Chapter 4.
不足为奇的是,第1章质量系统,不管分级如何,仍然是在检查缺陷中引用第1,是下一个领域第4章的缺陷的数量的2倍多。
Critical deficiencies constitute only 2 percent of the total identified in 2018 and these are associated primarily with Chapter 1 and Annex 1. Approximately 37 percent of critical deficiencies cite requirements in Chapter 1 and approximately 22 percent cite requirements in Annex 1.
2018年发现的严重缺陷仅占2%,主要与第1章和附录1有关。大约37%的严重缺陷引用了第1章中的要求,大约22%引用了附录1中的要求。
Among the major deficiencies that constitute approximately 40 percent of the total deficiencies, Chapter 1 again leads the group with almost 800 deficiencies. The next three include Annex 15 with approximately 270, Annex 1 with approximately 260, andChapter 5 with approximately 250. Clearly, Quality Systems is again the substantial leader, as it is for critical deficiencies. Chapter 7, Chapter 8, and Annex 16 were among the top 10 in major deficiencies yet not among the top 10 for critical deficiencies.
在约占总缺陷40%的主要缺陷中,第1章又以近800个缺陷引领了这一类缺陷。后3个包括附录15,约270个,附录1,约260个,第5章,约250个。显然,质量体系再次成为实质性的领导者,因为它存在严重缺陷。第7章、第8章和附录16属于主要缺陷的前10名,但不属于严重缺陷的前10名。
Computerised Systems, Annex 11, remains in the top 10, reinforcing the importance of this area to data integrity and the regulator’s focus on the control and management of electronic data.
计算机化系统(附录11)仍在前10之列,加强了这方面对数据完整性的重要性,以及监管机构对电子数据控制和管理的重视。
文章来源:允咨GMP制药技术
本网站刊载的所有内容,包括文字、图片、音频、视频、软件等,如非标注为“原创”,则相关版权归原作者所有,如原作者不愿意在本网站刊登相关内容,请及时通知本站,我们将第一时间予以删除。