扫一扫 添加小助手
服务热线
13818320332
扫一扫 关注我们
 Routine review and analysis of environmental monitoring data is essential to aid in the interpretation of process stability and assess overall control performance. Management should be kept abreast of trends and the subsequent state of operations within their facilities.
常规审查和环境监测数据的分析对于协助工艺稳定性解释并评估整体控制性能是必要的。管理应与设施趋势和运行的随后状态同时进行。
Based on the large number of samples tested by a given facility, a computer-based data tracking system is recommended. Prior to implementation, all database ap-plications used should be validated/qualified for specific software applications.
根据规定设施测试的样品数量,建议采用基于计算机的数据跟踪系统。在执行之前,应验证/确认所有数据库应用程序的具体软件应用情况。
1. Data Collection 数据采集
Routine data may be pooled into a designated database in a consistent record format. The record format should include (at a minimum): monitoring date, specific sam-pling locations, sampling methods, colony forming units (CFU) or non-viable count results, identification performed, product lot information, and current action level. A manual data entry or image scanner system with advantages of speed and accuracy can be used to populate tables. Data integrity must be verified prior to analysis.
常规数据可能会按统一的记录格式集中到指定的数据库中。记录格式(至少)应包括:监测日期,具体的取样地点,取样方法,菌落形成单位(CFU)或非活性的统计结果,鉴别完成,产品批号信息和当前行动等级。人工数据输入或有速度和准确性优势的图像扫描系统可用于填充表。数据完整性测试应在分析前确认。
2. Data Analysis 数据分析
Trends are often difficult to obtain and recognize, given the low colony forming unit (CFU) result usually obtained with viable environmental monitoring data. His-tograms, defined as pictorial graphs characterized by a number of data points that fall within a common frequency, are a valuable tool. Different room classifications with definite requirements will produce different histograms. The CFU spread obtained across a Class 100,000 data set will not be observed in a data set from a Class 100 area. Therefore, each area (or area type) and accompanying data set must be viewed as distinct. A mathematical model could be applied not only with the objective in mind, but also the type of data to be analyzed.
由于低菌落形成单位(CFU)的结果通常与活性的环境监测数据同时获得,因此很难得到并确认趋势。柱状图,定义为共同频率下一系列数据点形成的图案图表,是一个有价值的工具。明确要求的不同房间分级将产生不同的柱状图。100,000级区的数据集中获得的CFU将不会从100级区数据集获得。因此,每个区(或区类型)和随附的数据集必须被看作是独一无二的。数学模型不仅可以应用到目标中,也能应用到将分析的数据类型中。
Moreover, data collected in Class 10,000 or 100,000 areas tend to assume distributions. A Class 10,000 facility may lend itself to an exponential distribution where the majority of data points can be observed below the mean and thus appear not normally distributed; and a class 100,000 or non-classified area often dem-onstrates greater variability around the mean with a normal distribution. A Class 100 area distribution may be less obvious where an unsystematic approach, although less powerful, may work best.
此外,10,000级或100,000级收集的数据用于假定分布。A级10,000设施本身可能带来指数分布,大部分数据点都低于平均值,从而出现非正态分布;100,000级或非分级区域通常用正态分布显示更大的均值变量。使用非系统的方法处,100级区的分布可能不那么明显,作用可能不大,但效果可能最好。
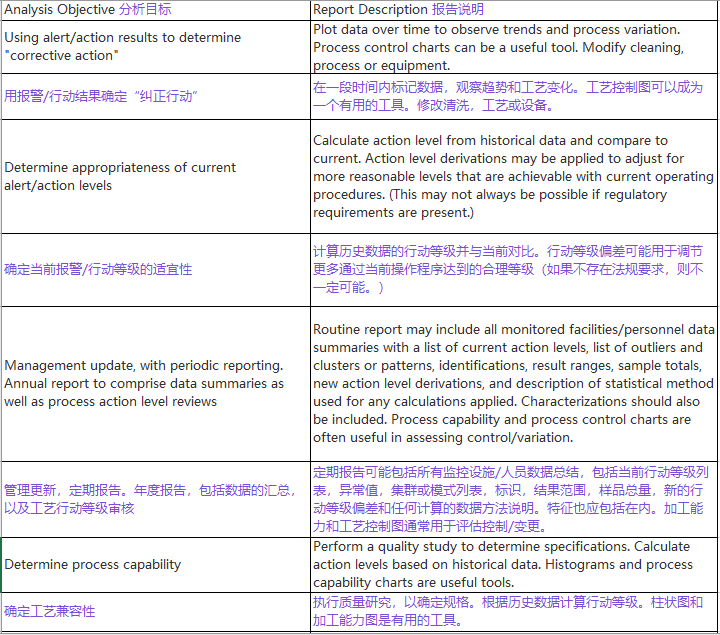
The following table provides some examples of different analysis objectives and the associated descriptions of what the analysis may include.
下表提供了一些不同分析目标的例子,及可能包括哪些分析的相关说明。
3. Data Approach 数据处理方法
The following approach describes a generalized method for data to assess the environmental control:
下面的方法描述了数据的广义方法,以评估环境控制:
a. Determine objective of analysis (e.g., site location alert/action, action level review, management update).
确定分析的目标(例如,选址警报/行动,行动等级审核,管理更新)。
b. Specify data set to be analyzed. 指定将分析的数据
c. Apply data plots such as histograms or pictorial plots to access the basic data and to determine the nature of the distribution, if any. Such data plots can also be used to locate peculiarities such as outliers or patterns.
如存在,使用数据图,如柱状图或图示以评估基础数据并确定分布的性质。这些数据也可用于定位,如异常值或模式。
d. Observe the distribution and proceed with the appropriate mathematical model that best fits the overall objective. If data conform to a specific distribution, a parametric mathematical model may be applied. If the data are not consistent with a particular distribution, then a non-parametric approach may be applicable.
观察分布并继续使用最适合总体目标的相关数学模型。如果数据符合特定分布,可以应用一个参数数学模型。如果数据不符合特定分布,那么非参数方法可能适用。
e. Typically, an action level at the 99th percentile is employed. Consistent with the action level at the 99th percentile are the following mathematical models. Models can only be applied if the character of the data assumes a definite distribution.
通常使用第99个百分数的行动等级。与第99个百分数的行动等级一致的为以下数学模型。数据特征呈现特定分布时才能使用模型。
Action level estimate for a data set reflecting an exponential or non-normal distribution = 4.6 x (mean CFU)
数据集预估的行动等级反映指数或非正态分布= 4.6 ×(平均CFU)
Action level estimate for a data set reflecting a normal distribution = 2.33 a + (mean CFU)
数据集预估的行动等级反映正态分布= 2.33a +(平均CFU)
Note: When the action level is determined at the 99th percentile, an occasional excursion is expected due to the model applied.
注:当第99个百分数确定为行动等级,偶尔偏差则由于使用的模型导致。
f. Regardless of the statistical model chosen, the analytical method should be consistent with the data and documented in the data summary along with results.
不管选定什么统计模型,分析方法应符合数据并与结果一起记录在数据汇总中。
Examples of possible analysis objectives and possible report descriptions. 可能的分析目标和报告说明举例
4. Data Interpretation 数据解释
Data generated should be summarized and evaluated to determine whether the production environment is in a state of control. Statistical process control is one method of performing this evaluation.
应总结并评估生成的数据,以确定生产环境是否处于控制状态。统计工艺控制是进行此评估的一种方法。
Trends may show a gradual increase or decrease in the overall counts observed over time, or a change in flora or counts on several plates of a particular area on a given day. Interpretation of the impact of a significant fluctuation in counts or a change in flora should be based on the experienced judgment of a qualified person.
趋势可能会在观察时间内显示总数的逐渐增加或减少,或在指定某天特定区域的几块板上的菌落或计数变更。计数的重大波动或菌落变更的影响应由有经验的人员判断。
Some considerations for assessing process state of control are listed below: 评估工艺控制状态的几点考虑如下
a. In assessing environmental monitoring process reliability, derived action levels reflecting higher values than those currently imposed may be indicative of a process specification that is no longer appropriate. A review of the process may be needed.
评估环境监测工艺的可靠性时,得出的行动等级比当前等级更高时,可能说明此工艺规格不再适用。可能需要审核工艺。
b. Several consecutive points or drifts may be considered to be a pattern or cluster formation that, if above the alert level, signals a trend that requires an investigation.
连续几个点或漂移可能被认为是一种模式或集群的形成,如果超过警戒水平,标志着趋势需要进行调查。
c. Significant fluctuations or jumps in the values for the process are also significant where recurring cycles may point to seasonal variations.
工艺值的重大波动或跳跃同样重要,反复循环可能表明季节性变化。
d. One or more values markedly higher or lower than the majority of the data may or may not be process outliers.
一个或多个值明显高于或低于大多数数据可能是或不是工艺异常值。
Understanding the potential impact of the results generated during environmental monitoring is critical to a successful environmental monitoring program.
了解环境监测期间产生的结果的潜在影响对成功进行环境监测计划非常关键。
文章来源:药品微生物检测
本网站刊载的所有内容,包括文字、图片、音频、视频、软件等,如非标注为“原创”,则相关版权归原作者所有,如原作者不愿意在本网站刊登相关内容,请及时通知本站,我们将第一时间予以删除。